From insight to action
Decision Tools
A dashboard becomes useful when it connects signals with transmission paths, consequences, thresholds and management choices. The tool supports judgment; it does not substitute for it.
Interactive decision support
See how connected signals become decision questions.
Open the live dashboard to explore solvency position, capital drivers, market pressure and management response options.
What the view connects
One data point informs. Connected data points reveal patterns. Patterns sharpen decisions.
This is not an insurer ranking, prediction or recommendation. It is an illustrative educational tool. Company specific decisions require validated data, actuarial and financial analysis, and management judgment.
Featured decision tool
Indonesia Life Insurers Solvency Insight
An interactive view connecting insurer solvency, financial capacity, market conditions and emerging pressure signals.
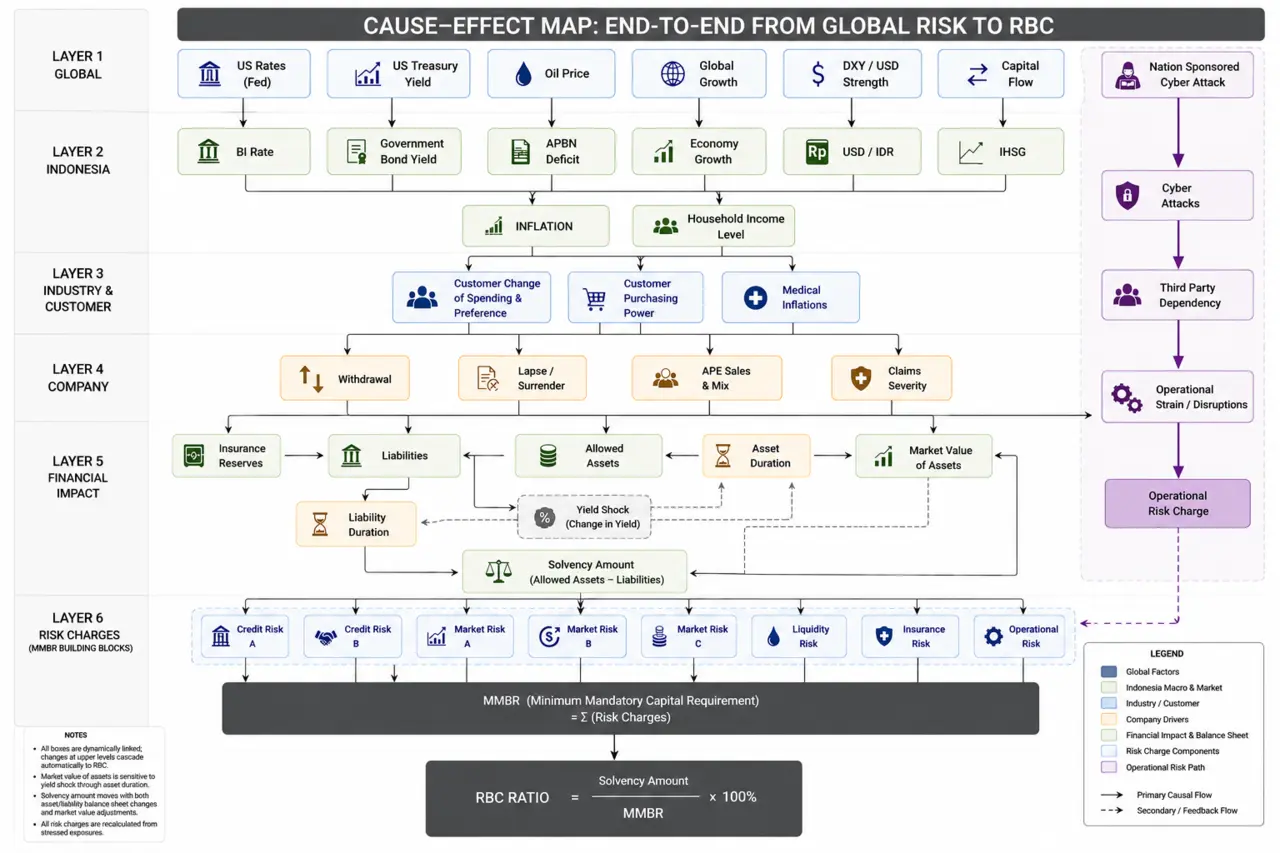
The dashboard moves discussion beyond a single reported solvency ratio. It follows how global and macro conditions may transmit through the insurance industry, the balance sheet, available and required capital, and the choices available to management. The practical question is not only where solvency stands, but what is driving it, how the position may change and which actions remain executable.
Explore the dashboardHow to read the dashboard
From signal to consequence to action
- 01 / Signal
Observe what is changing
Start with the direction of global, macroeconomic, market and industry signals. A data point matters when it changes an assumption, not simply because it moved.
- 02 / Transmission
Trace how pressure could travel
Consider how those signals may affect assets, liabilities, earnings, liquidity, policyholder behavior and capital. Look for interaction rather than assessing each pressure alone.
- 03 / Decision
Convert insight into preparedness
Use the connected view to sharpen questions about buffers, limits, scenarios, triggers and management actions. The dashboard supports judgment; it does not make the decision.